Insights
Automated Invoice Capture Software: 10 Tools Compared, Honestly Rated
10 automated invoice capture tools compared honestly. Includes real cost data, ROI calculator, format support matrix, and an 8-point evaluation checklist.
TallyScan Team
Picture this: your online store just had its best month ever. Orders are flying out the door, revenue is up 30%, and you're feeling great. Then you sit down with your numbers. After paying your supplier, shipping costs, and that new packaging you upgraded to, the profit is… barely anything. Your most popular product, the one customers rave about, is making you almost nothing on every single sale.
This is the trap that catches more small business owners than almost anything else: confusing revenue with profit, and sales volume with financial health. The fix is surprisingly simple. A handful of margin calculations in Excel can tell you in minutes which products are genuinely working for you, and which ones are just keeping you busy.
Whether you run a product-based shop, a service business, or manage finances for a growing team, these formulas are not complicated. You don't need an accounting degree. You need a spreadsheet, the right formula, and the clarity to act on what the numbers are telling you. Below, you'll find each calculation broken down step by step, with common mistakes flagged along the way, so your Excel sheet becomes your own personal profit margin calculator.
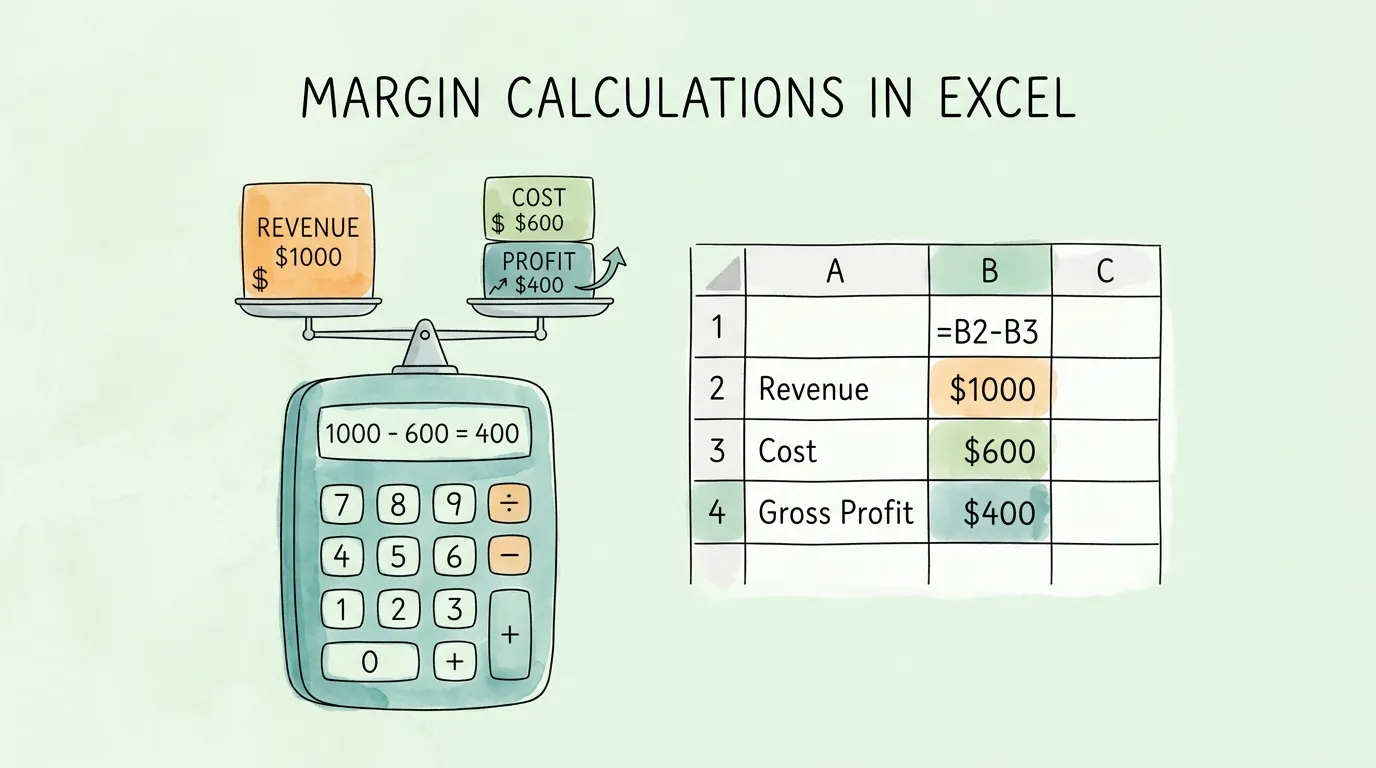
At its core, a margin calculation answers one question: of every dollar you bring in, how many cents are actually yours to keep?
The formula is =(Revenue - Cost) / Revenue. That's it. But the power isn't in the formula itself; it's in applying it consistently across every product and service you offer. That's when a spreadsheet stops being a boring list of numbers and starts being the most honest advisor in your business. It will show you that the item you've been promoting for months is barely breaking even, or that your "slow seller" is quietly your most profitable line. This kind of clarity is essential for improving accounts payable efficiency and making smarter decisions about where to put your energy.
Before diving in, here is a quick reference table for the core metrics covered in this guide:
| Term | What It Measures | Simple Formula |
|---|---|---|
| Gross Margin | Product-level profitability, before overhead | (Revenue - COGS) / Revenue |
| Operating Margin | Profitability after direct and operating costs | (Operating Income) / Revenue |
| Net Margin | Overall business profitability after all expenses | (Net Income) / Revenue |
| Markup | How much you increased the price over cost | (Price - Cost) / Cost |
One of the first hurdles in financial analysis is choosing the right metric. Each margin type answers a different business question.
Gross margin measures the profitability of individual products or services before accounting for overhead like rent, utilities, or marketing. It focuses strictly on the direct costs of production (COGS).
=(C2-B2)/C2 where C2 = Selling Price, B2 = COGSOften overlooked, operating margin is the bridge between gross and net. It deducts your operating expenses (salaries, rent, software) but excludes interest and taxes. This is the best measure of your core business efficiency.
=(Revenue - COGS - Operating Expenses) / RevenueNet margin is the "big picture" metric. It tells you how much actual profit the entire business earns after every single expense is paid, including taxes and interest. Keeping a sharp eye on this number is central to any sound small business accounting tips practice.
=(Net Income / Revenue)| Gross Margin | Operating Margin | Net Margin | |
|---|---|---|---|
| Scope | Product Level | Core Business | Entire Company |
| Costs Included | COGS only | COGS + OpEx | All Expenses + Tax |
| Primary Use | Pricing Strategy | Efficiency Analysis | Business Sustainability |
Contribution margin is one of the most searched and most misunderstood profit concepts in Excel. It answers a specific question: if you sell one more unit, how much of that sale actually contributes toward covering your fixed costs?
Contribution Margin formula: =(Revenue - Variable Costs) / Revenue
The key distinction is what counts as "costs":
| Gross Margin | Contribution Margin | |
|---|---|---|
| Costs Deducted | COGS (direct production costs) | Variable costs only |
| Best Used For | Product-level profitability vs. revenue | Break-even analysis and pricing decisions |
| Fixed Costs Included? | Sometimes (if absorbed into COGS) | No — fixed costs are excluded entirely |
| Excel Formula | =(Price - COGS) / Price |
=(Price - Variable Costs) / Price |
Pro Tip: Use contribution margin when you need to answer "how many units do I need to sell to break even?" It is the right metric for that calculation. Use gross margin when you need to compare product profitability or negotiate with suppliers.
For a deeper dive into variable cost tracking and how it connects to your supplier invoices, our guide on invoice management best practices shows how to keep these cost inputs accurate automatically.
Confusing margin and markup is one of the most common and costly mistakes business owners make. While both use the same variables (Price and Cost), they tell completely different stories.
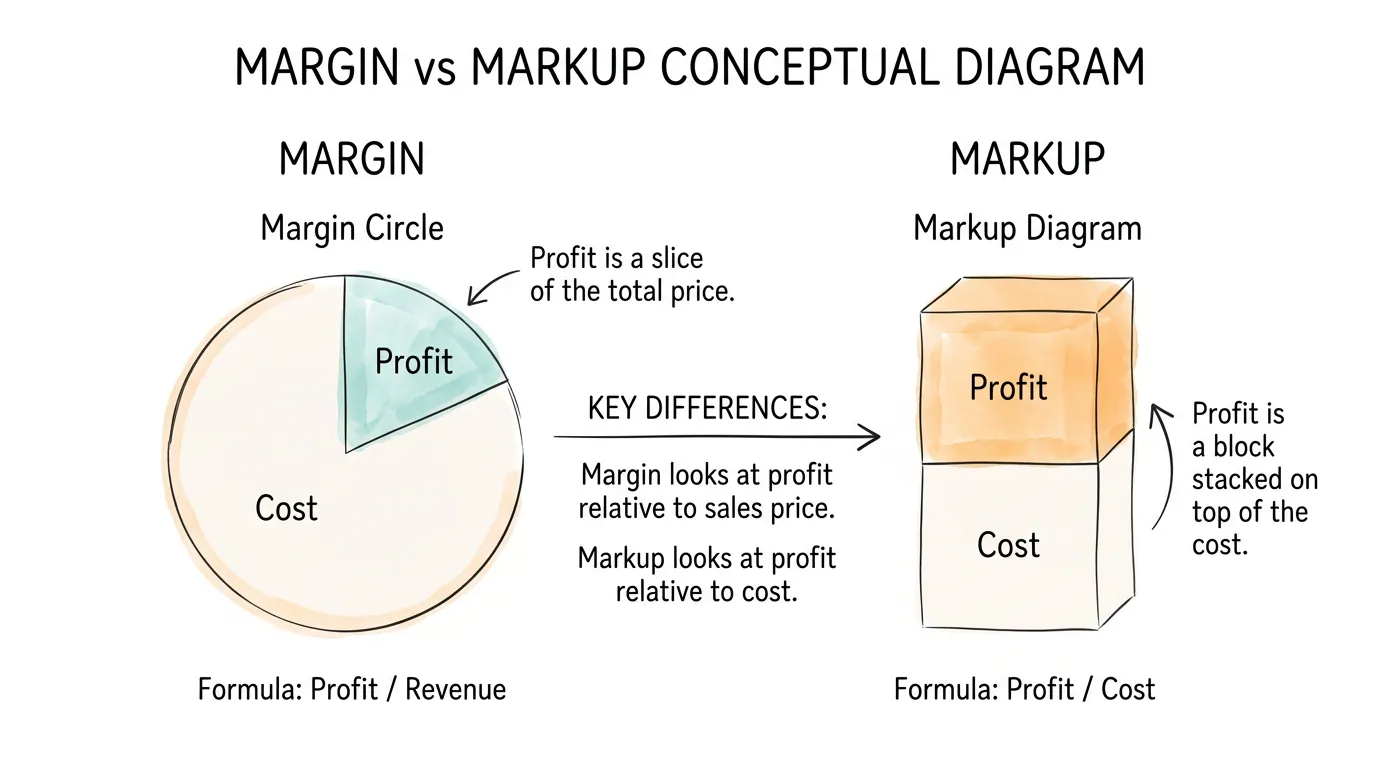
Imagine a product that costs $75 and sells for $100.
=(100-75)/100 = 25%=(100-75)/75 = 33.3%If you want a 25% margin but mistakenly apply a 25% markup, you will end up selling the item for $93.75 instead of $100, losing $6.25 in profit on every single sale. At scale, this is a catastrophic error. This is one key reason teams adopt accounting automation software: to remove these manual formula mistakes before they compound.
| Metric | Excel Formula | Denominator | Example (Cost $75, Price $100) |
|---|---|---|---|
| Margin | =(Price - Cost) / Price |
Selling Price | 25% |
| Markup | =(Price - Cost) / Cost |
Cost | 33.3% |
Rule of Thumb: Use markup to set a price. Use margin to analyze profitability. They are not interchangeable.
Let's build a practical margin tracker from scratch.
Create a clean spreadsheet with four columns:
Clean data is the foundation. Do not mix operating expenses (salaries, rent) into your COGS column, as that will give you a distorted, unreliable picture.
In cell D2, type:
=(C2-B2)/C2
This finds the profit (Price minus Cost), then divides by the Price to express it as a margin percentage.
Pro Tip for Variable Costs: If you buy the same product from multiple suppliers at different prices, use a weighted average cost formula rather than the most recent price. This prevents your margins from looking artificially high or low based on a single outlier purchase. You can automate the collection of these cost documents using invoice scanning software.
Once your basic formulas are in place, these Excel features will transform your data into a genuine decision-making engine.
Use Conditional Formatting to highlight margin danger zones automatically. Set rules to:
This transforms a dense table into an at-a-glance health check.
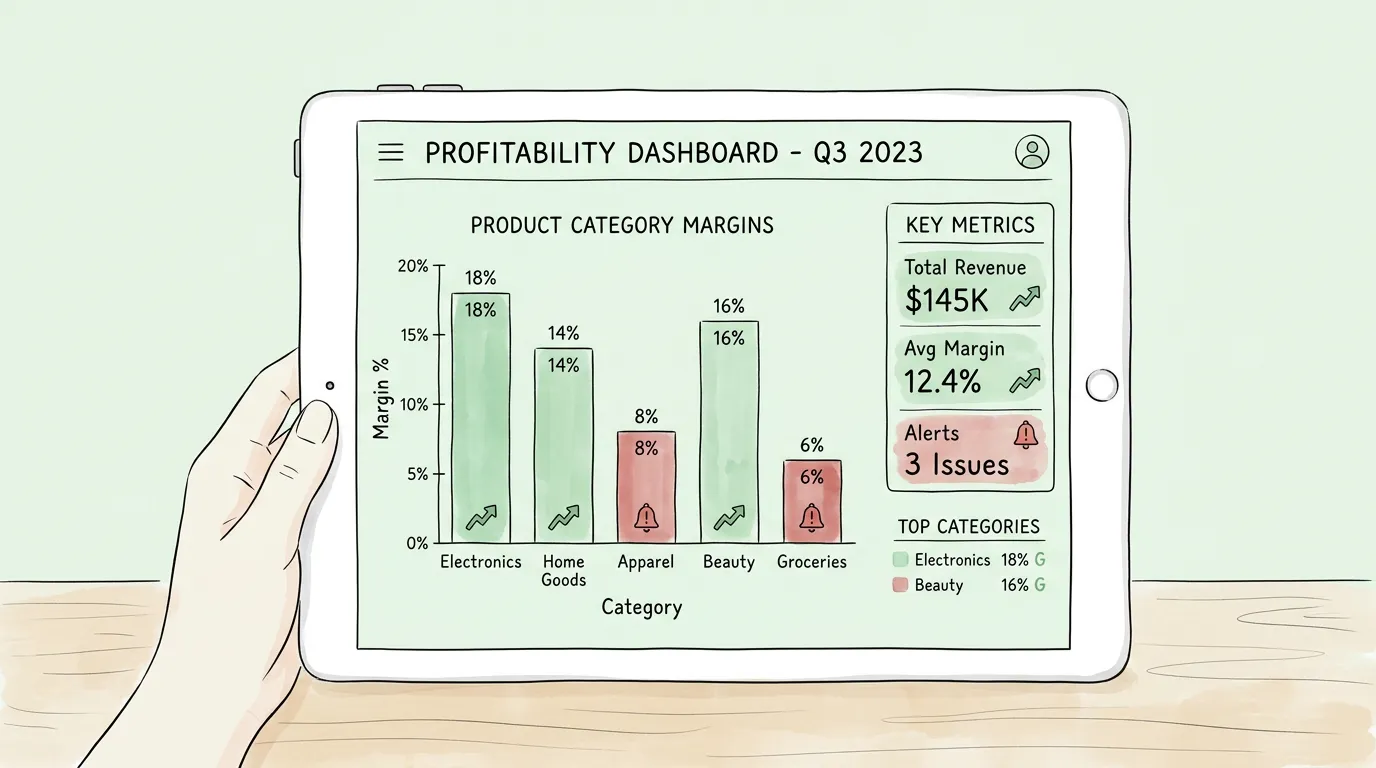
Use a PivotTable to roll up individual product margins by category. This answers questions like:
These are the insights you simply cannot find by scanning rows of raw data.
Need to know what selling price achieves a 30% margin, given a fixed cost? Use Data → What-If Analysis → Goal Seek. Set the Margin cell to 0.30 by changing the Selling Price cell. Excel will calculate the exact price you need to charge.
Add a commentary column with a simple formula:
=IF(D2<0.15,"⚠ Review Pricing", IF(D2<0.25,"Watch", "✓ Healthy"))
This gives every product a written status label next to its margin percentage, perfect for sharing dashboards with non-finance stakeholders.
While "good" varies by industry and business model, here are widely cited targets:
| Industry | Gross Margin Target | Net Margin Target |
|---|---|---|
| Retail (General) | 20% – 35% | 3% – 6% |
| SaaS / Software | 70% – 90% | 20%+ |
| Consulting / Services | 50% – 70% | 15% – 30% |
| Manufacturing | 25% – 40% | 5% – 10% |
| Food & Beverage | 60% – 70% | 3% – 9% |
According to Wikipedia's analysis of gross margin, these figures can shift significantly based on market competition and supply chain pressures. For a more granular breakdown, NYU Stern's industry-level margin data is an excellent free resource.
Consistently tracking your numbers against these benchmarks is what separates reactive businesses from strategic ones.
Even experienced analysts make these errors. Be aware of them:
If your cost is $80 and you want a 20% gross margin, use this formula to calculate the required selling price: =80 / (1 - 0.20). The result is $100, meaning a $20 profit on a $100 sale equals a 20% margin.
The standard formula is =(Selling Price - COGS) / Selling Price. In a typical spreadsheet where Column B is COGS and Column C is Selling Price, it would read =(C2-B2)/C2.
The most common cause is cell formatting. If cell D2 is formatted as "Number" with zero decimal places, a result of 0.25 will display as 0. Select the cell, click the "%" button on the Home ribbon, and it will correctly show as 25%.
Returns and discounts must be subtracted from Gross Revenue to arrive at Net Revenue. Always use Net Revenue as the denominator in your margin formula. Using inflated gross figures creates a false sense of profitability. Solid reconciliation practices (covered in our balance sheet reconciliation checklist) will keep these figures accurate.
Yes, always. Because markup divides by the lower number (Cost) and margin divides by the higher number (Selling Price), the markup percentage will always exceed the margin percentage for the same product.
This depends heavily on the industry. As a general starting point, a gross margin above 40% is considered solid for most small businesses, but service businesses often target 60%+. Benchmark your margins against your specific sector using authoritative sources like NYU Stern's industry data.
These two terms are related but measure different things. Gross profit is a dollar amount: Revenue - COGS. Gross margin is that same number expressed as a percentage of revenue: (Revenue - COGS) / Revenue. For example, if you sell a product for $100 and it cost $60 to produce, your gross profit is $40 and your gross margin is 40%. Gross margin is more useful for comparison across products or periods because it normalizes for scale.
Most small businesses benefit from a monthly review of gross margins by product or service line, which catches rising supplier costs or shipping fee increases before they compound. A quarterly review of operating and net margins gives you a fuller picture for pricing strategy and budget decisions. If you sell seasonal products or experience frequent supplier price changes, a weekly spot-check on your top-selling SKUs is worth adding. Automating cost data collection with bookkeeping AI tools means your spreadsheet is always current without manual data entry.
Your margins don't lie. Revenue can flatter you; margin cuts through the noise. Once you have a working profitability model in Excel, the conversation inside your business changes: product decisions get sharper, pricing conversations stop being guesswork, and you can actually see which part of the business is carrying everything else. If you're spending more time chasing cost data from supplier invoices than reading the model itself, learn how TallyScan automates invoice data extraction so your spreadsheets are always working from accurate, up-to-date numbers.
10 automated invoice capture tools compared honestly. Includes real cost data, ROI calculator, format support matrix, and an 8-point evaluation checklist.
Manual AP costs $10-$15 per invoice. This guide maps where your process breaks down, the seven fixes with the best ROI, and the KPIs to track real improvement.